Visme vs Canva: Which Visual Content Tool Is Better?
Compare Visme and Canva for data visualization, reports, interactive publishing, presentations, PowerPoint export, campaigns, and team governance.
 Anvisha Pai, Co-founder & CEO, Moda
Choose Visme when the work centers on data-heavy presentations, infographics, reports, interactive charts, embedded content, and measuring how published material is viewed. Choose Canva when you need a broader visual workspace spanning social content, presentations, documents, video, whiteboards, websites, print, and a much larger template ecosystem.
The meaningful difference appears after the first page looks good: whether the content must preserve structured data and interactive behavior, or expand quickly across many communication formats.
This comparison is based on official documentation, independent reviews, and clearly labeled user reports. We did not run our own paid head-to-head test, so the evaluation below focuses on documented workflows and a representative report test rather than invented quality scores.
Visme vs Canva at a glance
| Question | Visme | Canva |
|---|---|---|
| Best for | Reports, infographics, interactive data and published experiences | Broad visual content produced by many teams |
| Data strength | Charts, maps, widgets and interactive publishing | Charts and Sheets inside a wider content suite |
| Sharing strength | URL, embed, analytics and HTML5 options | Templates, collaboration and multi-format adaptation |
| PowerPoint handoff | Editable PPTX, with interaction and animation limits | PPTX export, with conversion checks required |
| Main limitation | More specialized and plan-dependent exports | Less specialized interactive-report workflow |
Where Visme wins
Data visualization is closer to the core
Visme’s data-visualization tools support charts, graphs, maps, data widgets, animation, and connections to sources including Google Sheets and Excel Online. The value is not simply the number of chart types. It is that a chart can remain part of a published interactive story rather than becoming a decorative image on a slide.
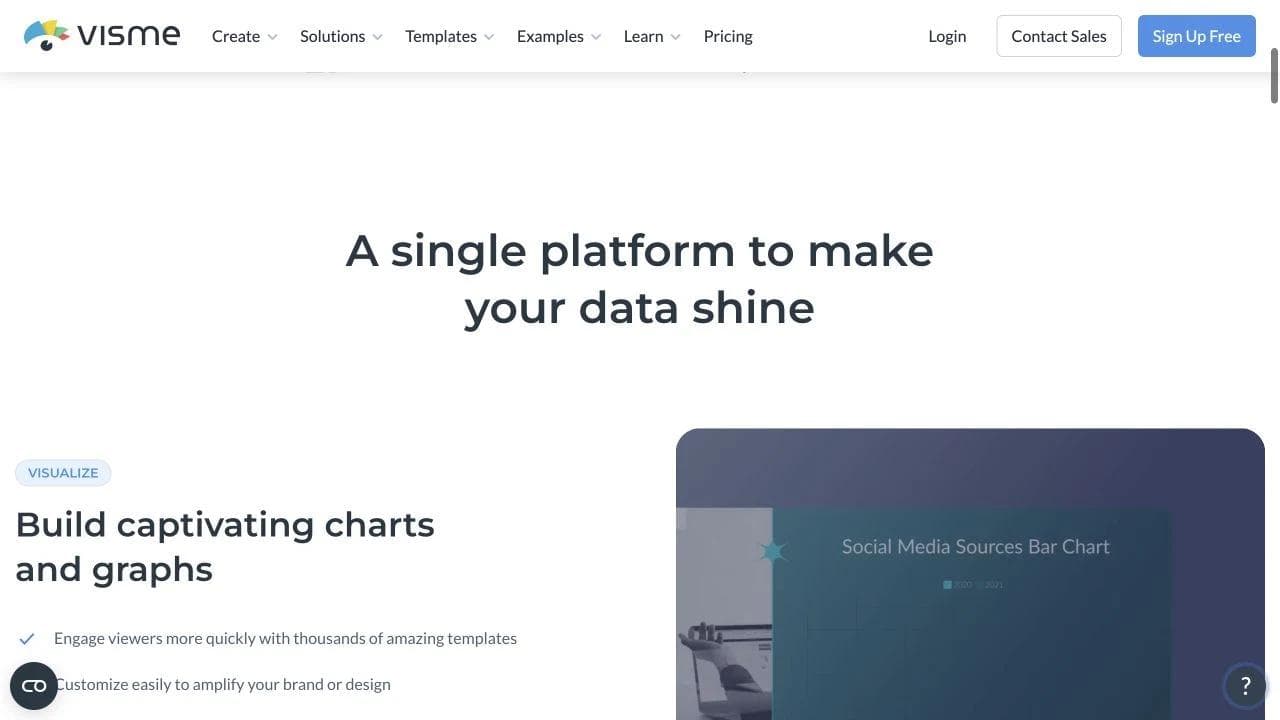
This is useful for quarterly reports, public infographics, training material, and customer-facing data stories. It does not make Visme a business-intelligence system. Data modeling, access control, auditability, and operational dashboards may still belong in a dedicated analytics product.
Interactive publishing and measurement are explicit workflows
Visme can publish or embed interactive work and documents an HTML5 download path that preserves animations and interactive elements for offline viewing. Its current product FAQ also distinguishes editable PPTX from HTML5 and describes the different preservation tradeoffs.
These capabilities are plan-dependent. Before paying, verify the exact analytics, password and privacy controls, embed options, lead capture, HTML5 access, and download formats required by the project. A view count is not the same as attribution, CRM reporting, or revenue analytics.
Reports and infographics receive specialized attention
Visme puts reports, white papers, infographics, charts, maps, timelines, and professional documents beside presentations. That reflects a product shaped around structured business communication. The advantage is clearest when a team repeatedly turns research and data into branded multi-page material, not when it needs one square social graphic.
Independent evidence broadly supports that positioning. G2’s review summary highlights ease of use, templates, and interactive branded visualization, while also noting that some reviewers want more template depth. Treat aggregate reviews as directional evidence, not proof that a specific export or data workflow will fit.
Where Canva wins
Canva is the broader visual workspace
Canva’s Visual Suite spans presentations, Docs, Sheets, Whiteboards, social formats, video, websites, email, and print. Canva also offers chart and graph tools inside that broader environment. That breadth matters when one team moves among a campaign brief, deck, post, email, report summary, and short video during the same week.

Canva is usually the easier organization-wide default because more jobs can begin from the same templates, assets, and brand environment. A specialist may still produce the source analysis or chart, but more teammates can adapt the communication around it.
Templates and everyday adoption favor Canva
Canva’s template-first workflow and large asset library reduce setup for occasional creators. Brand Kits and Brand Hub can centralize approved assets across many formats. Visme also targets non-designers and offers brand controls, so the useful test is not “which looks easier?” It is whether the least-frequent creator can make an approved update without breaking the file.
A recent independent Style Factory comparison found the editing interfaces broadly similar while treating Canva as the wider general-purpose platform. That is more useful than assuming either product wins every format.
Mixed-format campaigns are a stronger reason to choose Canva
For a launch requiring a deck, social clips, square and vertical graphics, a landing page, and print collateral, Canva offers the more unified production path. Visme can create several of those formats, but its differentiation becomes strongest when the content is interactive, embedded, analytical, or report-led.
Presentations and PowerPoint handoff
Both products can create presentations. Choose Visme when the deck depends on interactive charts, embedded content, data widgets, or a published experience whose engagement you want to inspect. Choose Canva when the presentation belongs to a larger campaign and teammates value broad templates, media, and adaptation.
For an editable PowerPoint deliverable, test early. Visme’s PPTX documentation says text and elements remain editable, but slide transitions, animated graphics, some custom fonts, and Visme-specific effects may not transfer. It recommends URL, PDF, or HTML5 delivery when preserving the Visme experience matters more than PowerPoint editability.
The same principle applies to Canva exports: being able to download a PPTX does not guarantee identical fonts, charts, media, animation, or layout in the recipient’s environment. Ask whether the audience needs a faithful final presentation or a native working file they will continue editing.
Brand governance, collaboration, and plan gates
Both products offer team and brand workflows, but individual plans do not necessarily include the controls required by a larger organization. Check template ownership, font and color restrictions, approval flows, guest access, analytics, download formats, and what happens to files when a creator leaves.
Run a governance test with an approved template. Ask one user to make a permitted copy change and another to break the brand deliberately. Then inspect what administrators can prevent, detect, approve, or restore. “Stores our logo” and “governs distributed production” are different requirements.
How AI should influence the decision
Visme offers AI for presentations, documents, design, images, and text. Canva embeds AI across its broader suite. The presence of an AI button does not establish output quality or maintainability.
Give each tool the same source report and ask for a ten-page presentation. Verify every claim, then change one fact, one chart, one brand color, and one paragraph. Create a second format without regenerating the work. The better system is the one that leaves an understandable editable file for the next teammate.
Where Moda fits
Moda is relevant when the bottleneck is turning a brief into an original, editable presentation, ad, social post, PDF, or diagram. Its agent works on an editable canvas, allowing the team to continue revising the design rather than accepting a flattened generation.
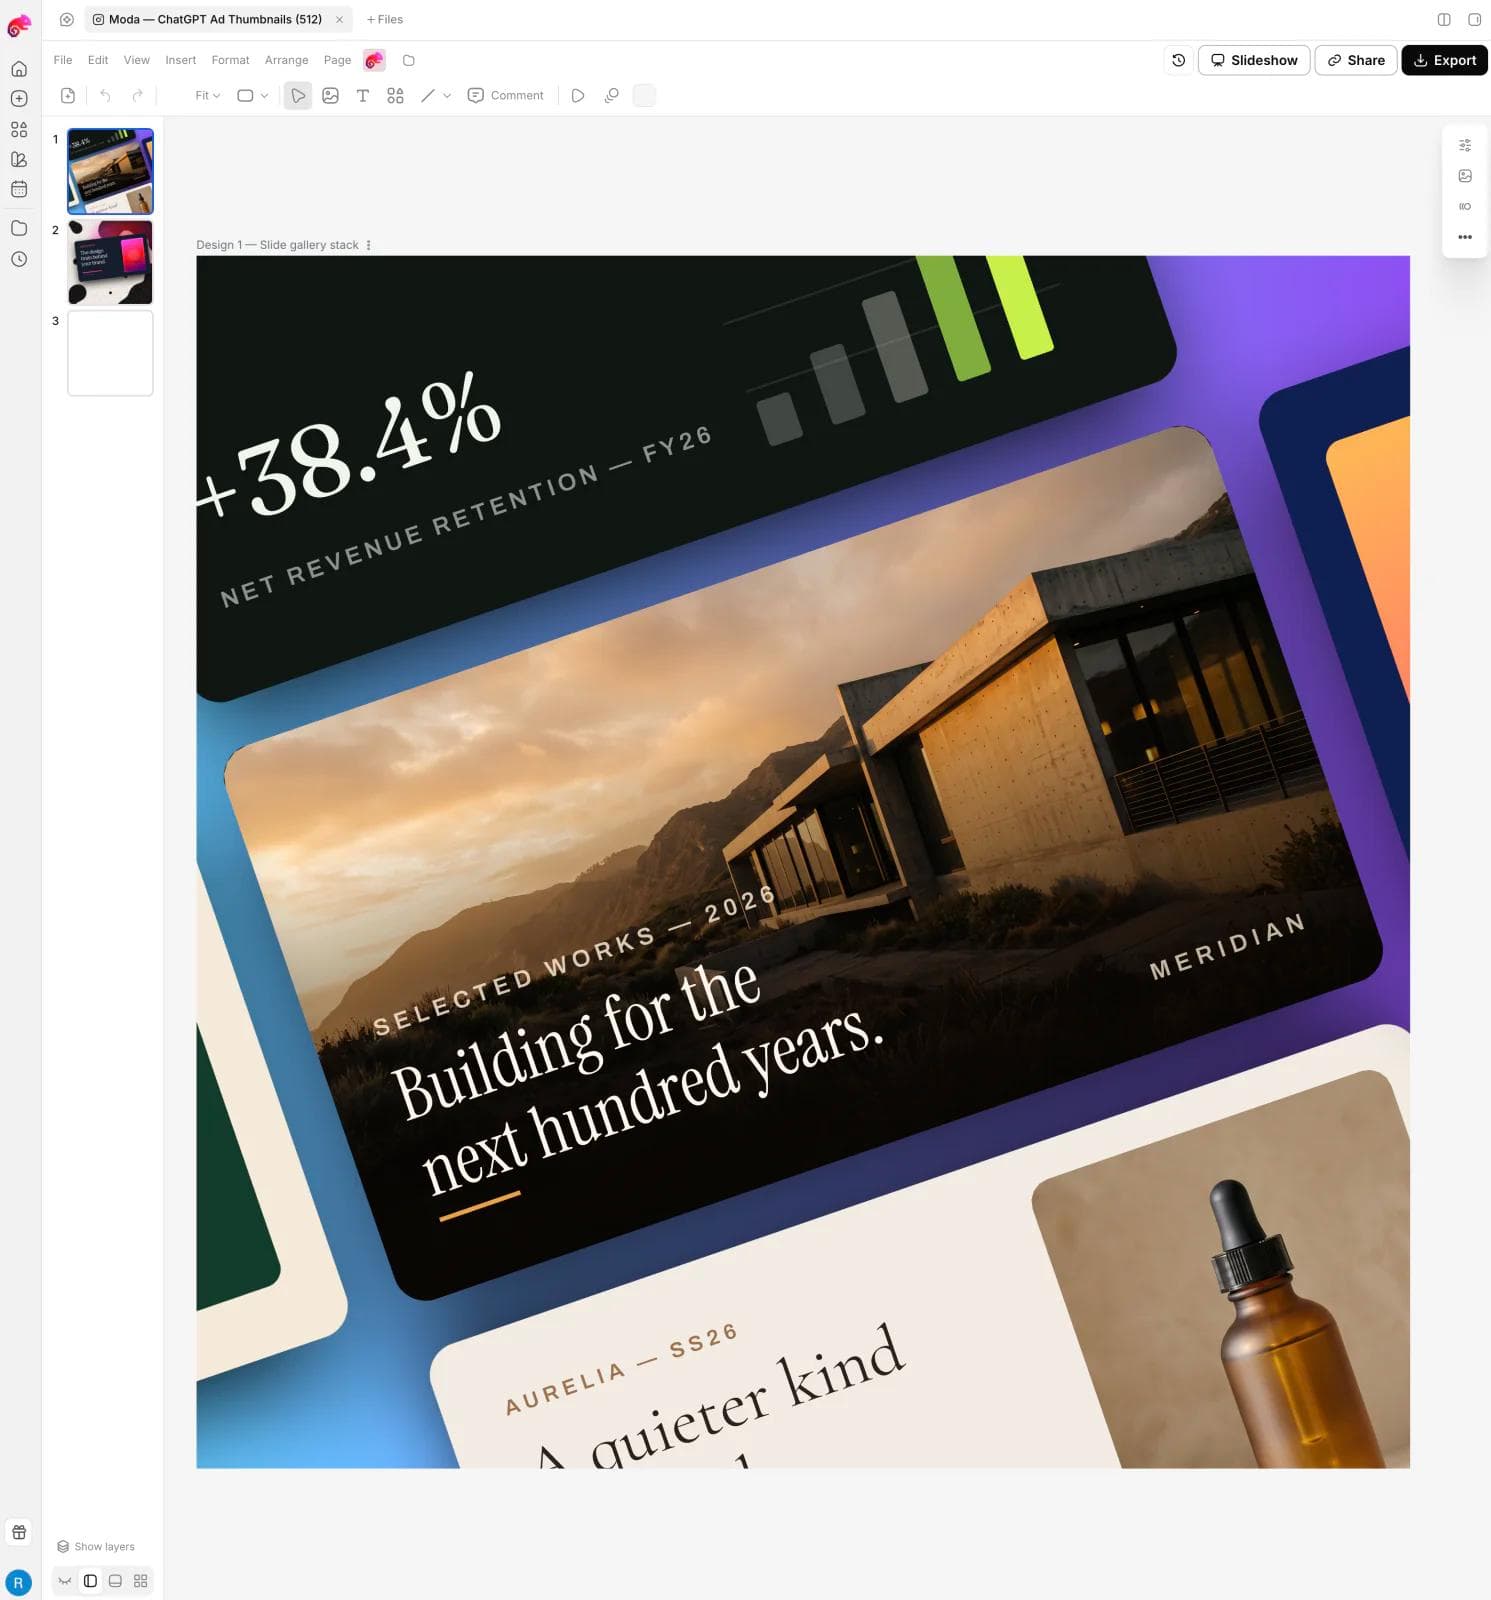
Moda does not replace Visme’s interactive data-publishing and content-analytics workflows. It also does not replace Canva’s complete template and workplace ecosystem. Choose Moda when AI-led visual creation is central, Visme when structured interactive communication is central, and Canva when breadth and organization-wide adoption are central.
A five-part comparison test
- Build one ten-page report from real copy, a spreadsheet, a map, and several chart types.
- Publish or embed it and test interaction, accessibility, privacy, and mobile behavior.
- Export an editable PPTX and inspect fonts, charts, tables, media, notes, animations, and spacing in PowerPoint.
- Turn the central finding into a presentation, square post, vertical story, and short video.
- Have a second teammate update one data point, one brand color, and one paragraph without help.
Visme or Canva: the verdict
Choose Visme for data-heavy reports, infographics, interactive visualizations, embedded content, and published material whose engagement matters. Choose Canva for a broad mix of everyday content produced by many people across marketing, sales, education, and internal communication.
If the overlap remains unclear, start with the hardest recurring deliverable. A square graphic will not expose much. A report that must become an executive deck, web embed, editable PowerPoint, and social campaign will reveal which workflow actually fits.
Frequently asked questions
Is Visme better than Canva for infographics?
Visme is generally the stronger starting point when the infographic depends on structured data, interactive charts, maps, or web embedding. Canva is often faster when the infographic is one item in a broader campaign and template breadth matters more.
Can Visme export an editable PowerPoint?
Yes. Visme documents editable PPTX export, but animations, transitions, custom fonts, and Visme-specific effects may not transfer perfectly. Test a representative deck in the recipient’s PowerPoint environment.
Can either tool replace a BI platform?
No. Both can communicate data visually, but they do not replace the modeling, access controls, lineage, refresh guarantees, and analytical governance of a dedicated business-intelligence system.

Real editable visuals. Real canvas. Full control.
Fly through design work