Gantt chart slide templates
Gantt chart slides on a real grid: twelve months, sixteen weeks, planned against actual, workstream colours, quarterly phases, sprints, a site programme.
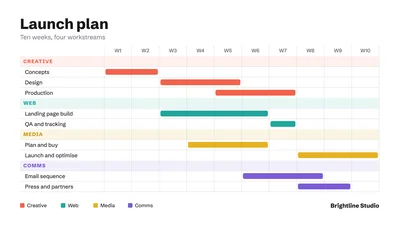
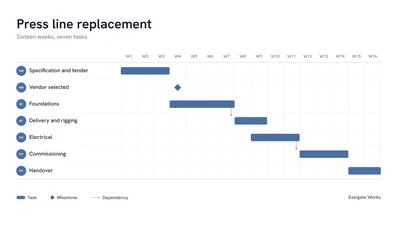
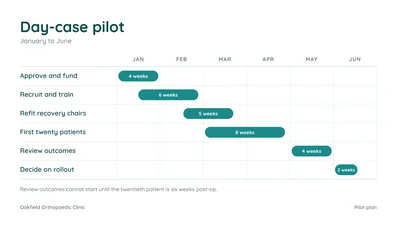
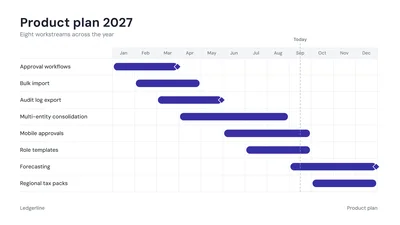
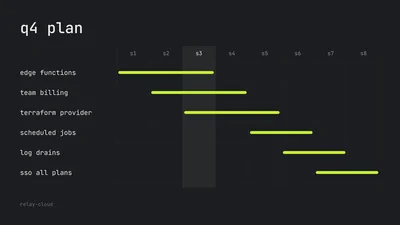
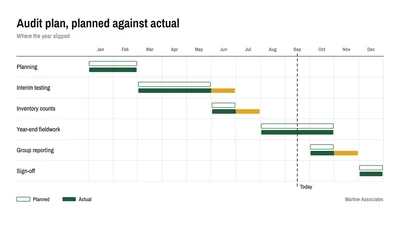
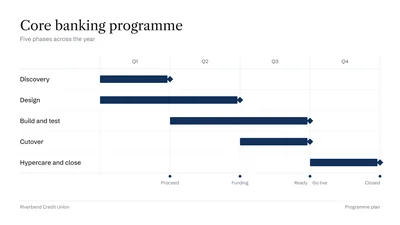
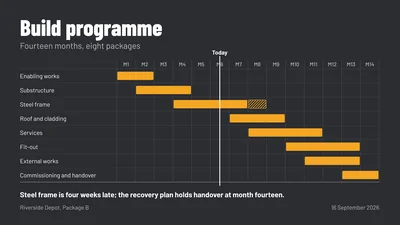
A Gantt chart pasted from a project tool is unreadable on a slide, and one drawn in a slide tool takes an afternoon. These are drawn as bars on a month or week grid with each bar, milestone and today-line as its own editable shape. The layouts cover a twelve-month product plan with milestones, tasks with owners and dependency arrows, planned against actual with slippage visible, four workstreams in colour, quarterly phases with gates, a sprint grid, six tasks with durations written in, and a fourteen-month site programme with a hatched slip. Restyle to your brand and export to PowerPoint.